🔌 Battery Voltage Behavior and Internal Resistance
Understanding voltage behavior during discharge is essential for evaluating a battery’s power performance. A simple yet effective approach is to model the battery using an equivalent circuit composed of:
- An open-circuit voltage (OCV) source
- A single internal resistance: R0
This model captures key dynamics such as voltage drop under load.
⚙️ Equivalent Circuit Model
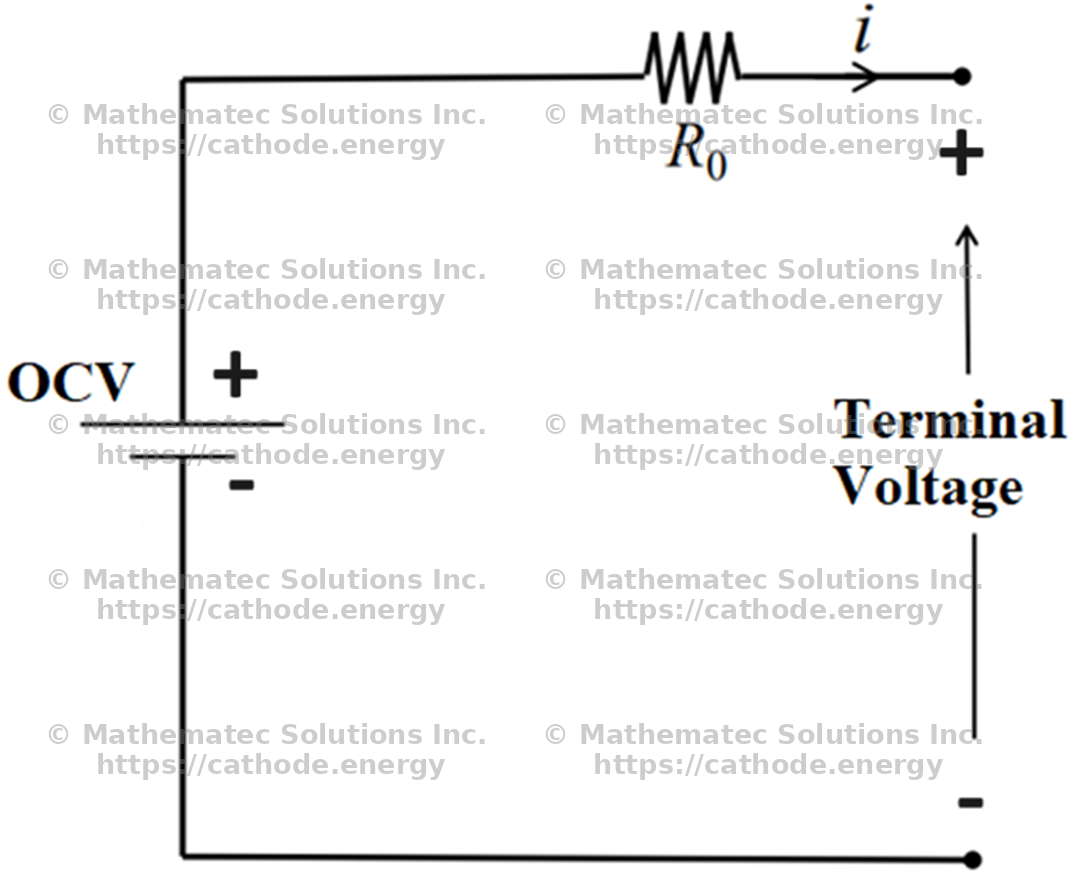
Figure: Simple Battery Equivalent Circuit
The terminal voltage ( V ) during discharge can be expressed as:
$$ V = \text{OCV} - I \cdot R_{\text{0}} $$
Where:
-
OCV(SOC): Open-circuit voltage as a function of state of charge
-
I: Discharge current (positive when discharging)
-
R0: Internal resistance (ohms)
📉 Voltage vs. Depth of Discharge
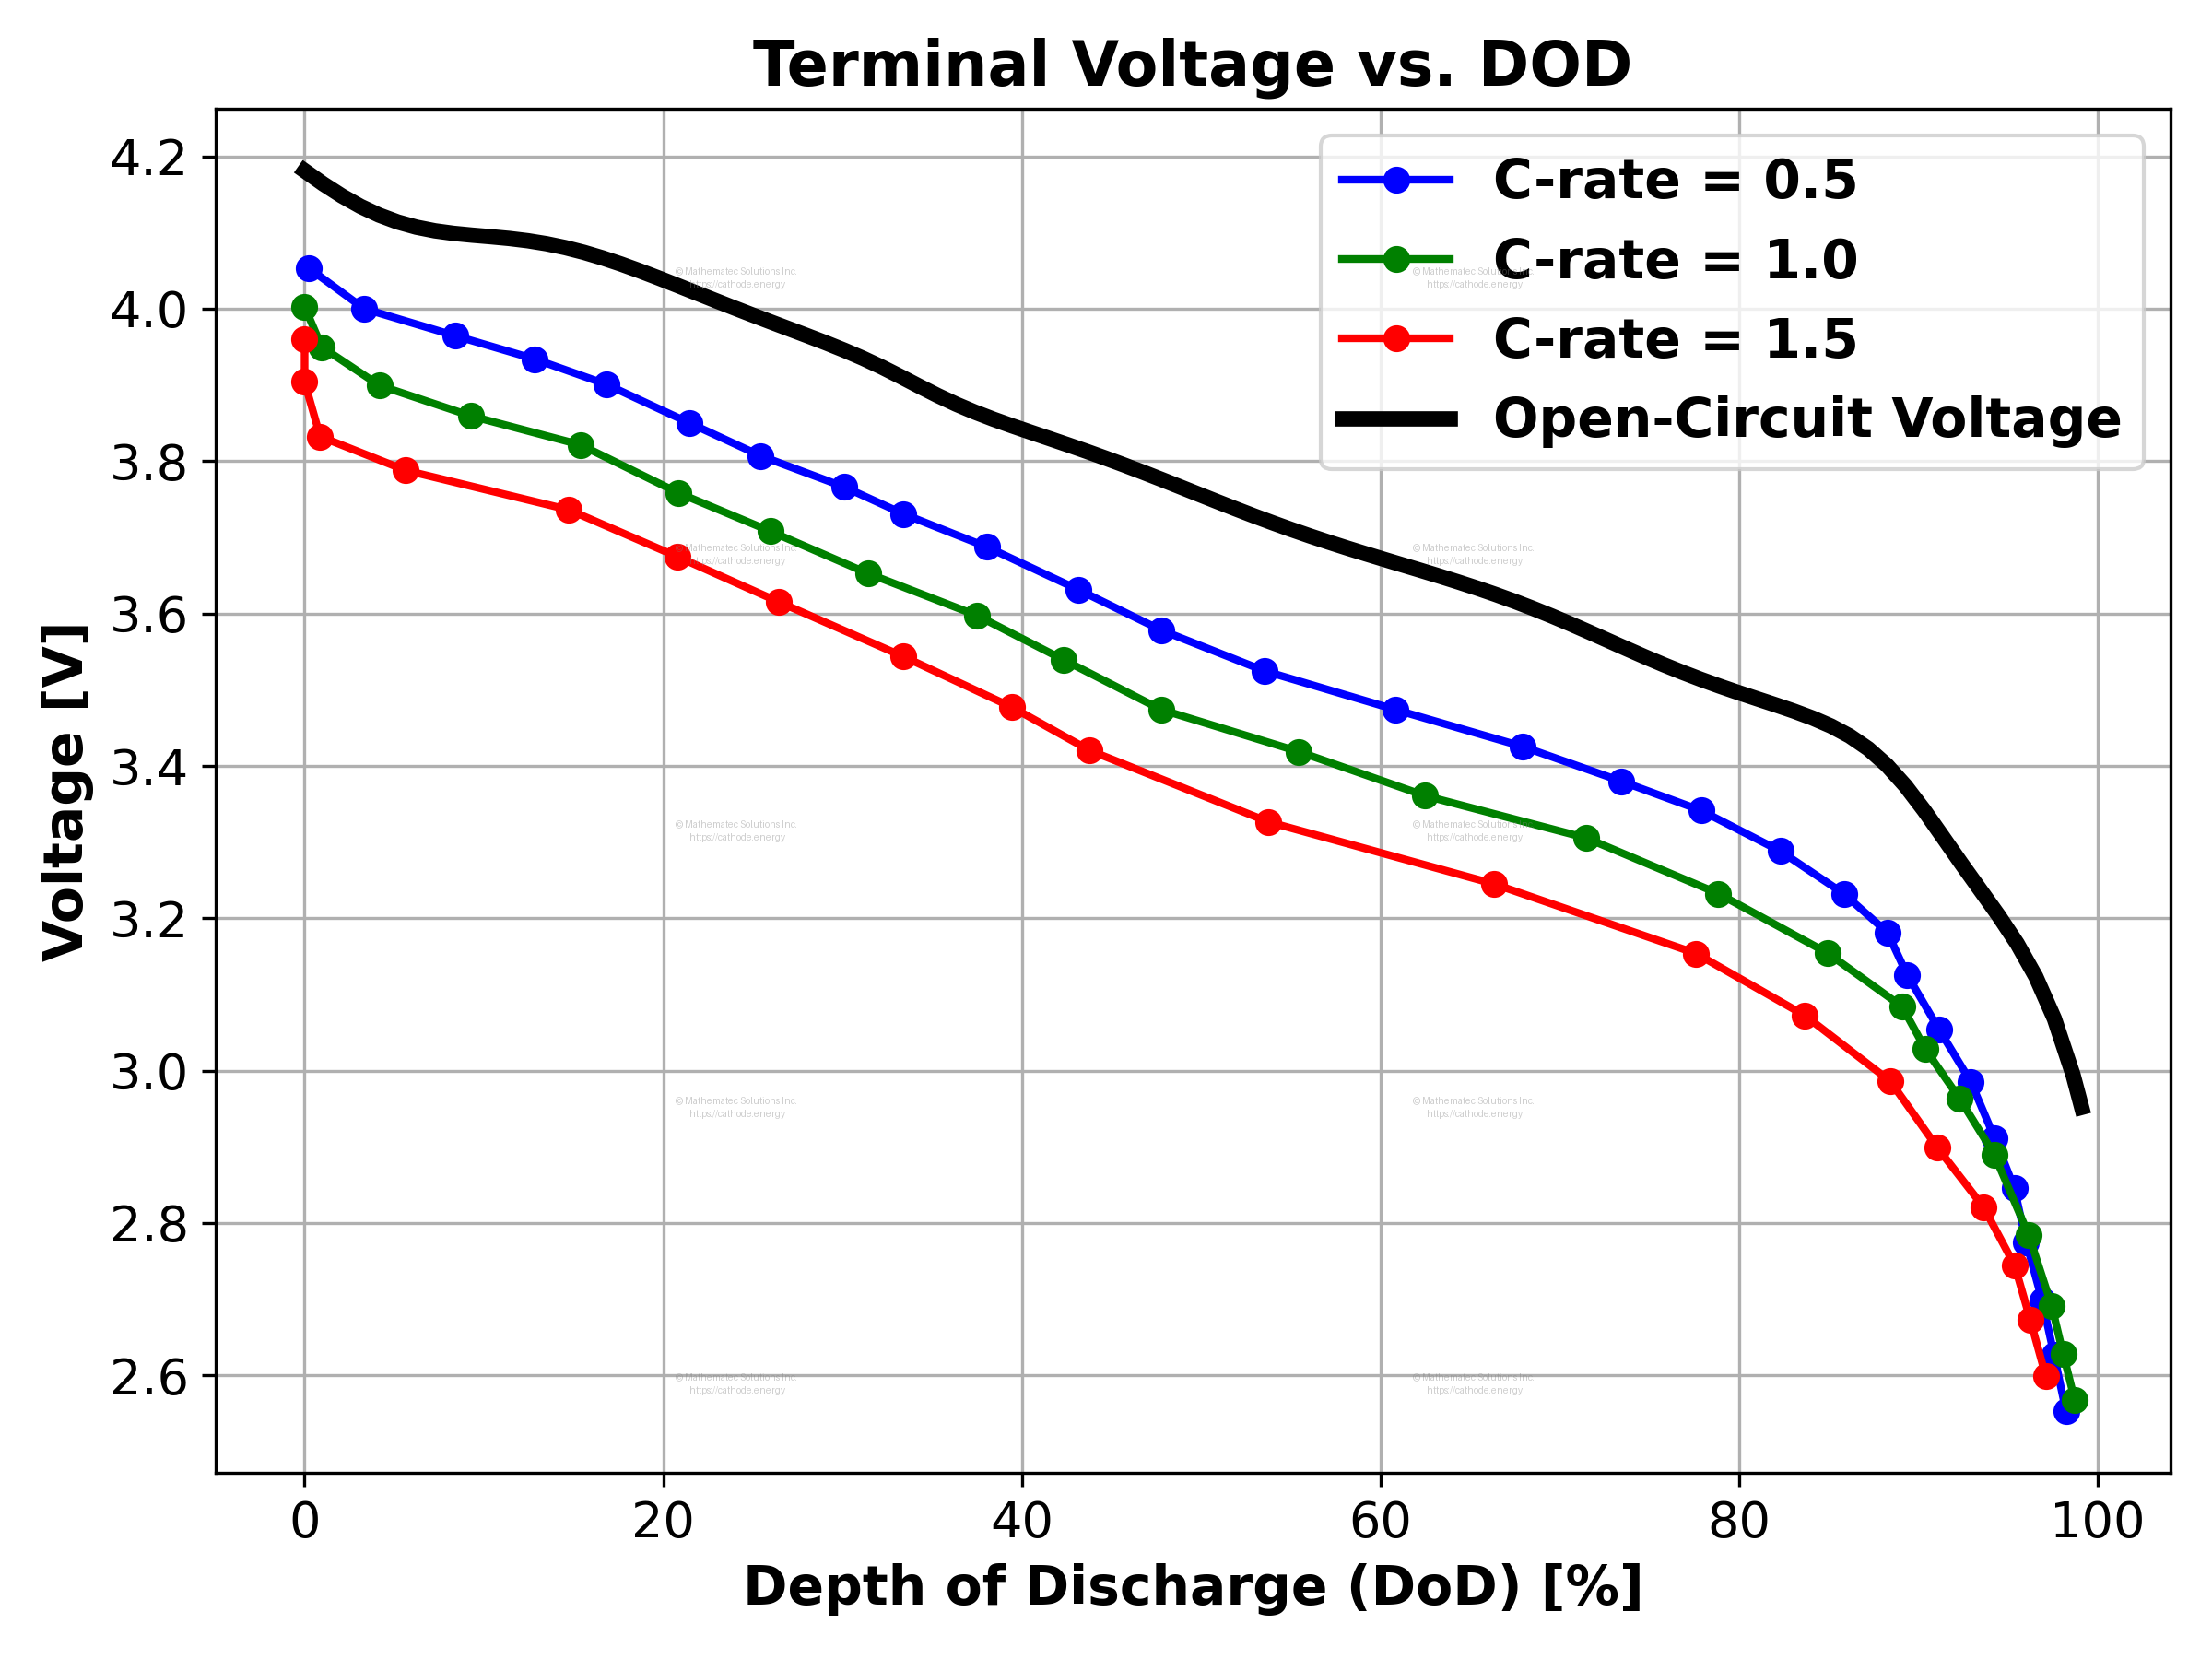
Figure: Discharge voltage curves at different C-rates
Observations:
- OCV Curve: Represents the equilibrium voltage without current.
- Voltage Drop: Increases with higher current due to I*R0 .
- Higher C-Rate → Lower Terminal Voltage: At 1.5C, the voltage drops more rapidly compared to 0.5C.
This behavior illustrates the importance of accounting for internal resistance in both modeling and real-world performance evaluations.